Maps and Local Water Quality Reports
Water from a household tap — understanding what’s in our drinking water is vital to protecting health.1, 2
Introduction: Why Water Contamination Data Is Critical for Public Health
Clean drinking water is fundamental to life and health. Yet millions of Americans may be exposed to contaminants in their tap water without even realizing it. In 2015, for example, nearly 77 million people (roughly one in four U.S. residents) got their water from systems that violated federal safety standards.1 These violations ranged from elevated lead and arsenic levels to harmful bacteria and chemicals. Public health crises like the Flint, Michigan lead contamination – where tens of thousands were exposed to dangerous lead levels3 – underscore how serious the consequences can be when water quality data is ignored or hidden.
Reliable water contamination maps and local water quality reports are critical because they inform communities about what’s in their water and empower the public to take action. In fact, many people find themselves asking “Is my water safe in [State]?”—the answer lies in understanding and accessing these water quality data resources. Transparency is key; when contamination data is publicly available, communities can press for solutions. Lack of transparency or even data removal has raised concerns among watchdogs. Notably, a nationwide study found there is likely significant under-reporting of water safety violations,1 making independent and updated water quality information even more important.
In the sections below, we’ll explore common contaminants in U.S. water, how to find and interpret your local water quality reports, examples of regional water issues, and steps you can take to test and improve your own water’s safety.
Transparency is key; when contamination data is publicly available, communities can press for solutions. Lack of transparency or even data removal has raised concerns among watchdogs.
Common Contaminants in U.S. Water Systems
America’s drinking water can contain a cocktail of pollutants, some regulated and others emerging. Here are a few of the most common contaminants and their effects:
- PFAS (Per- and Polyfluoroalkyl Substances): Nicknamed “forever chemicals,” PFAS are a group of man-made compounds used in non-stick cookware, firefighting foam, waterproof fabrics, and more. They have been detected in water supplies across the country. Health effects from PFAS exposure include increased cholesterol, hormone disruption (e.g. thyroid problems), decreased fertility, developmental delays in children, reduced immune response, and higher risk of certain cancers.4 PFAS persist in the environment and human body, and no federal drinking water standard existed for them as of the mid-2020s (though regulatory standards are under development). This means even legally “clean” water could contain PFAS at levels of concern.
- Lead: Lead usually leaches into drinking water from old lead pipes, solder, and plumbing fixtures found in many older homes and city infrastructure. There is no safe level of lead exposure, especially for children. Even low concentrations can harm the brain and nervous system, leading to lowered IQ, learning and behavioral problems, and developmental delays in kids.2 In adults, lead can contribute to high blood pressure, kidney problems, and reproductive issues. The EPA’s health goal for lead in water is 0 ppb (zero)5 because any amount poses a risk, but the current federal action level requires systems to take corrective action if lead exceeds 15 ppb in tap samples. High-profile cases like Flint, MI have shown how corrosive water chemistry can suddenly spike lead levels and create a public health emergency.
- Nitrates: Nitrate contamination primarily comes from agricultural runoff (fertilizers and livestock manure) seeping into groundwater and rivers. Nitrates are especially problematic in rural areas and farming regions. Infants are the most vulnerable – consuming formula made with nitrate-contaminated water can cause methemoglobinemia, or “blue baby syndrome,” a condition that reduces oxygen in the blood and can be fatal to babies. The EPA’s Maximum Contaminant Level (MCL) for nitrate is 10 mg/L (10 ppm), set to protect infants. Consistently high nitrate levels have also been linked to increased risks of certain cancers and thyroid problems in adults. In states like Iowa and California, dozens of small communities have struggled with nitrate levels approaching or exceeding the safe limit, highlighting a widespread issue in U.S. water systems.6
- Arsenic: Arsenic is a naturally occurring element found in some groundwater (particularly in parts of the West and Northeast) as well as a contaminant from industrial sources. Long-term exposure to arsenic in drinking water is known to cause skin lesions and significantly increase the risk of cancer (such as skin, bladder, and lung cancers). It has also been associated with cardiovascular disease and diabetes. The EPA enforceable limit for arsenic is 10 ppb, but studies suggest even lower levels over time can be harmful, so areas with arsenic issues often install special treatment or find alternate water sources.7
- Microbial Contaminants & Others: While the focus is often on chemicals, microorganisms like bacteria (e.g., E. coli), viruses, and parasites can also contaminate water and cause acute illnesses (from stomach flu to more severe infections). These typically arise from sewage leaks, improperly treated water, or flood events. Water utilities disinfect with chlorine or other methods to kill microbes, but sometimes disinfection byproducts (like trihalomethanes, haloacetic acids) form in the process. These byproducts at high levels over years have been linked to elevated cancer risks, which is why they are also regulated. Other noteworthy contaminants include copper (from plumbing, can cause gastrointestinal distress and liver/kidney damage at high doses) and Chromium-6 (an industrial chemical made famous by the Erin Brockovich case, a suspected carcinogen not yet regulated separately from total chromium).
Why it matters: Each contaminant carries its own risks – from immediate sickness to long-term chronic health effects. Knowing which pollutants are present in your local water system (and at what levels) is the first step in protecting your household. This is why we rely on regular water quality reports and mapping of contamination data.
Where to Find Local Water Quality Reports
If you’re wondering how to check “Is my water safe in [your state or city]?”, the good news is that water utilities are required to provide information on your drinking water quality. The cornerstone resource is your annual Consumer Confidence Report (CCR) – also called a water quality report. By law (Safe Drinking Water Act), every community water system must deliver a CCR to its customers by July 1 each year. Typically, this report is mailed to you (often included with your water bill) or made available online. Your CCR tells you where your water comes from (the source) and summarizes any contaminants detected in the past year, along with their levels and whether they meet safe standards.8
Where can you get your CCR? If you didn’t receive it, you can:
- Use the EPA’s CCR search tool or database: The U.S. EPA hosts an online lookup where you can find your local CCR by selecting your state and water system. Many CCRs are posted on utility or state websites. (Keep in mind not all small systems’ reports may be in the database, so you might need to contact the utility directly in some cases.)8
- Check your water utility or state agency website: Most water suppliers post their annual water quality reports on their official websites. State environmental or health departments often also maintain portals for local drinking water data. For example, some states have “Drinking Water Watch” or database websites where you can search for test results and any violations for water systems in that state.
- Contact your water provider: You can always call your city’s water department or the company that sends your water bill and ask for the latest water quality report. They are required to provide it. Renters who do not pay a water bill can request the report from their building management or find it online.9
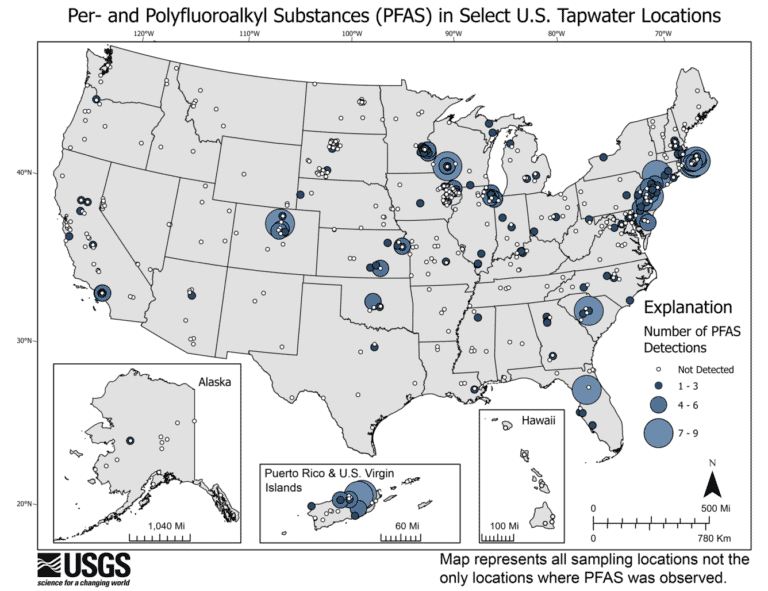
- Use third-party databases and maps: Beyond official sources, independent environmental organizations compile and present water quality data in user-friendly ways. A prime example is the Environmental Working Group (EWG)’s Tap Water Database, a free tool where you can enter your ZIP code to see the contaminants detected in your local water utility over recent years. The EWG database aggregates test results from across the nation and even compares contaminant levels to health guidelines (which are often stricter than federal legal limits). Similarly, EWG and other groups have created interactive water contamination maps USA-wide that highlight hotspots. If you search for a “water contamination map USA”, you’ll find resources like EWG’s map of PFAS pollution or other contaminants, showing which areas have known issues. These maps can be eye-opening – for instance, a recent analysis estimated that at least 45% of U.S. tap water sources contain one or more PFAS chemicals, and maps visualize how these detections are spread across the country.10, 11
- EPA’s “How’s My Waterway” and other tools: The EPA offers tools like How’s My Waterway that allow you to get information about local water bodies and some drinking water metrics by location. There’s also the EPA’s Enforcement and Compliance History Online (ECHO) database where you can lookup any recent violations for your water system. These tools can complement the CCR by providing broader context (for example, if your water system had any compliance issues or health-based violations in recent years).
One important note: If your water comes from a private well, you will not have a CCR because private wells are not regulated by EPA. In that case, the responsibility falls on the well owner to test the water (more on that in a later section). Your state or county health department can guide what tests are recommended for private wells.
Lastly, be aware that sometimes obtaining water quality data requires persistence. While the EPA and many states have improved online access to reports, there have been instances of data being less accessible or even removed due to various reasons (budget issues, political pressure, etc.).
If you suspect something’s off or can’t find recent data, you can file a request or even look for local news or watchdog groups that might have compiled information. Organizations like the Natural Resources Defense Council (NRDC) have in the past sued for transparency and highlighted when enforcement is lax or data is lacking. In one report, NRDC pointed out that lax enforcement and under-reporting mean official data might understate the true scope of contamination problems.1 That’s why it’s good to cross-check multiple sources – your official report, state databases, and independent reports – to get the full picture of your water quality.
How to Read and Interpret Reports
Once you have your local water quality report (or data from a credible online source), it’s important to understand what the numbers and terms mean. These reports can look technical, but here’s a breakdown of key concepts so an average reader can make sense of them:
- Contaminant tables: Your CCR will list various contaminants (often divided into categories like inorganic contaminants, organic contaminants, disinfectants, radionuclides, etc.), and typically include columns for the units, the level detected in your water, the regulatory limit, and possibly the ideal goal level. For each contaminant detected, you’ll see its measured concentration – e.g. “Nitrate: 4.0 ppm”. Units are usually in ppm (parts per million) or ppb (parts per billion) for chemicals. To visualize these tiny concentrations: 1 ppm is roughly like one drop of a contaminant in a 10-gallon tub of water.12 And 1 ppb is 1,000 times smaller — about one drop in an Olympic-sized swimming pool. So, if something is in the single-digit ppb range, that’s a very small trace, whereas a few ppm is a bit higher concentration.
- MCL (Maximum Contaminant Level): This is the EPA’s legal limit for that contaminant in drinking water. It’s the highest level allowed by regulation. If your report shows any contaminant level above the MCL, that’s a violation and a serious red flag.13 The water system is required to take action to fix the issue and notify customers of any health risks. Fortunately, most systems rarely exceed MCLs for regulated contaminants – when they do, boil-water notices or other warnings are typically issued.
- MCLG (Maximum Contaminant Level Goal): This is the health goal for the contaminant — often set at a level where no adverse health effects are expected. MCLGs are not enforceable, but they indicate the ideal. For example, the MCLG for lead is 0 ppb14 (because no amount of lead is considered safe), whereas the enforceable action level is 15 ppb. If your water report shows a contaminant at a level below the MCLG, it implies there’s no known or expected risk to health at that level.15 However, many contaminants have MCLGs that are the same as the MCL (or even set to zero) for precaution.
- “Your Water” level and Range: The report often shows the highest level detected (“Your Water” value) and sometimes the range of detections during the monitoring period.16 For instance, it might say Nitrate: Your Water = 4.0 ppm (range 2.5 – 4.0 ppm). This means multiple samples were taken; the lowest was 2.5 and highest 4.0, and 4.0 is what’s reported. Compare “Your Water” values to the MCL. If it’s safely below, that’s good. If it’s close to or equal to the MCL, the water was just at the legal limit — something to keep an eye on, as fluctuations could potentially exceed the limit.
- Violation/Compliance Status: The report will usually have a column or note if there was any violation in the last year. If all contaminants are under limits, it might say “No” in the violation column for each, or a statement that the system was in full compliance. If there was a violation (say a contaminant exceeded the MCL, or the system failed to test properly), the report must flag it and often will include an explanation and what is being done about it.
- Other terms: You might see “TT” (Treatment Technique) which indicates a required process instead of a numeric limit (for example, for some contaminants like certain pathogens, water systems must use specified disinfection steps – that’s a treatment technique requirement17). “AL” (Action Level) is used for lead and copper; it’s the level which, if exceeded by more than 10% of customer taps tested, triggers corrective action (15 ppb for lead, 1.3 ppm for copper). ND means “Not Detected.” NA means “Not Applicable.”
- Health effects language: By law, if any contaminant exceeded its MCL or any regulated contaminant was detected, the report will include brief statements about potential health effects. For example, it may note that infants who drink water high in nitrate could become seriously ill (blue baby syndrome),18 or that lead can cause developmental issues in children. Read these sections carefully — they tell you why regulators care about that substance. Even if levels are below the MCL, some reports include information on certain contaminants detected so you understand any possible concern if levels were higher.
- Comparison to prior years: If you have previous reports, compare them. Are contaminant levels trending down or up? A sudden jump in, say, disinfection byproducts or lead from one year to the next could indicate a change in treatment or source that might warrant asking your utility for more information.
It’s important to remember that just because water meets legal standards does not always mean it’s perfectly “pure” or risk-free. For instance, an area could have arsenic at 9 ppb, which is under the 10 ppb legal limit, but over decades of drinking that, there is still some elevated health risk. Similarly, unregulated contaminants like many PFAS might appear in the report (sometimes under an “unregulated contaminants monitoring” section) with no MCL listed. In such cases, compare those levels to health advisories or state guidelines. Tools like the EWG Tap Water Database can also help interpret whether a detected level, even if “legal,” is above the latest health-based recommendations. Use your report as a starting point: if something is detected at a notable level, do a little research on it or call your local health department for guidance.
Examples of Regional Contamination Issues

Water quality concerns aren’t just hypothetical – they happen in communities across the United States. Different regions face different challenges based on their infrastructure, industry, and geology. Below are a few real examples that illustrate why staying informed matters:
“Forever chemical” contamination is widespread across the country, often near industrial sites and military bases.19
- PFAS in New Jersey and Nationwide: In recent years, testing has revealed startling levels of PFAS chemicals in various communities. For instance, a rural area in New Jersey was identified as a PFAS hot spot with extremely high concentrations in a well, sparking federal investigation.20 Nationwide, at least 45% of tap water samples are estimated to contain one or more PFAS21 — an issue so pervasive that it’s been called a “PFAS contamination crisis.” Locations near airports, military bases, and manufacturing plants (where firefighting foams or PFAS-containing products were used) tend to have higher detections. Some states, like New Jersey and Michigan, have taken the lead in setting their own strict limits for PFAS in drinking water due to federal delays. Interactive water contamination maps often highlight clusters in the Northeast, Midwest, and around military installations in states like Colorado and California. This example underscores the value of both local testing and national maps – your water might be affected by industrial pollutants even if your area isn’t widely known for water issues.
Some states, like New Jersey and Michigan, have taken the lead in setting their own strict limits for PFAS in drinking water due to federal delays.
- Lead in Flint, Michigan (and other cities): The Flint water crisis of 2014–2016 is a stark reminder of how quickly a water supply can become dangerous. When the city of Flint switched its water source and failed to properly treat the water, it corroded aging pipes and caused lead to leach into thousands of homes. Lead levels in Flint’s tap water spiked so high that residents’ health suffered — children showed elevated blood lead, and at least 12 people died from a Legionnaires’ disease outbreak linked to the water quality issues.22 Flint’s case was extreme, but it prompted cities nationwide to re-examine their own lead pipes. Newark, New Jersey, Washington D.C., Chicago, and others have faced lead-in-water challenges due to old lead service lines. The takeaway: if you live in an older city or house with lead plumbing, pay extra attention to lead results in your water report (or consider getting your tap water tested directly). It also showed the importance of citizen advocacy — Flint residents’ complaints and independent tests forced authorities to acknowledge the problem. Now, massive efforts are underway across the country to map out and replace lead pipes, aided by federal infrastructure funding.
- Nitrates in Midwest Farming Communities: In America’s agricultural heartland, fertilizer and manure runoff have left a legacy of nitrate-contaminated water. For example, a survey of Iowa’s water systems found over 60 cities and towns had struggled with high nitrate levels in recent years.23 Some small towns in Iowa, Illinois, Wisconsin, and California’s Central Valley have had to drill new wells or install expensive treatment because nearby farm fields continually raise nitrate levels in groundwater. Private wells in rural areas are especially at risk — a study in Iowa showed thousands of private wells tested positive for unsafe nitrate or bacteria levels over a 15-year period.24 Excess nitrates not only cause blue baby syndrome in infants, but some research suggests potential links to increased cancer risks in adults at lower levels over time. Many communities now use source water protection strategies (like creating buffer zones or working with farmers on better practices) to try to reduce this contamination. If you live in a rural area or near farming operations, checking your water for nitrates (and perhaps pesticides) is crucial.
- Arsenic in the Southwest: In parts of Arizona, Nevada, and California, arsenic occurs naturally in groundwater at levels above the EPA limit. Small desert communities that rely on wells have historically had arsenic levels that required treatment. For example, some water systems in the Central Valley of California (Tulare County, etc.) have faced chronic arsenic issues, compounded by drought that concentrates minerals. Long-term residents in such areas face higher risks of skin issues and cancers due to arsenic.25 These communities often appear on “water systems with violations” lists year after year until improvements are made. If your report shows arsenic present (even below the MCL), it’s wise to stay informed on any efforts to lower it and possibly use a home filter that can remove arsenic for extra safety.
- Industrial Spills and Accidents: Occasionally, acute contamination incidents occur, like the 2014 chemical spill in West Virginia’s Elk River that left 300,000 people without safe tap water for days, or incidents of fuel or solvent spills that seep into water supplies. While these are rarer, they highlight why it’s good to know what upstream facilities or environmental issues exist around your water source (many reports include a brief “source water assessment” section describing potential sources of contamination). A local example is Camp Lejeune, North Carolina, where volatile organic chemicals contaminated base drinking water for decades mid-century, causing serious health effects – data that only came to light years later.
These examples from different regions demonstrate that water contamination can stem from aging infrastructure, agricultural practices, industrial pollutants, or natural geology. A “water contamination map USA” will show different clusters of problems — for instance, more nitrate and farm-related issues in the Midwest, mining-related metals in parts of the West, and legacy pollution in Rust Belt cities. No region is completely immune. Thus, wherever you live, it pays to read your water quality reports and stay alert to news about local water issues.
How Individuals Can Test and Improve Their Water Quality
Knowing about contamination is empowering — it allows you to take steps to ensure your own water is safe. Here are actions you can take as an individual or household:
Testing drinking water samples for chlorine levels
Home test kits and laboratory services can check for common contaminants like bacteria, lead, nitrates, and more.29, 30
1. Test Your Water at Home: If you have any concerns about your tap water, consider getting it tested. Testing is especially important if you use a private well, since no one else is monitoring that water for you. The EPA recommends private wells be tested annually for bacteria and nitrates, and periodically for other concerns depending on your area.26 Even on city water, you might want to test your home’s water if, for example, you have old plumbing (risking lead or copper), notice strange tastes/colors, or just want extra peace of mind. Remember, the city’s tests provide a system-wide picture and may not reflect conditions at your specific faucet.27 You can obtain test kits for DIY sampling (available online or at hardware stores) which you then send to a certified lab, or sometimes local health departments offer low-cost testing for residents. Common tests include: lead, copper, nitrate/nitrite, arsenic, microbial (coliform bacteria), and pH/iron (for plumbing corrosion).
2. Understand the Results: When you get a lab report from your own water test, it may list contaminants with their concentrations. Compare these to EPA standards or health guidelines (often the lab or your state will provide a sheet of benchmarks). If any result is above EPA’s MCL or even close to it, take action (either treatment or consulting with experts). For example, if your home test finds lead at 5 ppb, that’s below the 15 ppb action level, but above 0 ppb, so you’d want to minimize even that exposure — especially if you have young children.
3. Use Appropriate Water Filters: One immediate way to improve water quality at the tap is using a filter. The type of filter you need depends on the contaminants of concern:
- For lead — many faucet-mounted or pitcher filters are certified to remove lead (look for NSF/ANSI Standard 53 certification for lead). Make sure to choose a filter specifically certified for the contaminant you’re targeting.28 Change filters as directed; an expired filter may not work and can even grow bacteria.
- For chlorine byproducts or certain organics — activated carbon filters (like those in pitcher and fridge filters) are effective.
- For nitrates, arsenic, PFAS, or multiple contaminants — a more robust system like reverse osmosis might be needed. Reverse osmosis systems can remove a broad range of contaminants (PFAS, arsenic, nitrates, hexavalent chromium, etc.) by forcing water through a very fine membrane. They are installed under the sink or as whole-house systems.
- For bacteria — if biological contamination is an issue (e.g., for well water after floods), boiling water is a quick temporary fix to kill microbes. Long term, installing disinfection (like an ultraviolet light system or continuous chlorination) might be warranted for private systems.
Always verify that any treatment device is third-party certified (NSF, UL, or Water Quality Association) for the contaminants you need to remove. Using the wrong filter (or none at all) when you have a known contaminant can leave you with a false sense of security. For example, a simple charcoal filter will not remove nitrates.
4. Simple Safety Practices: Even without a filtration system, there are a few habits that can reduce risks:
- If your home has been sitting with water unused (overnight or all day), flush your tap for 30–60 seconds in the morning or when you come home. Stagnant water in pipes can accumulate metals like lead or copper — flushing brings in fresh water from the main.
- Use cold water for cooking and drinking, since hot water can leach more metals from pipes. Heat cold water on the stove if needed, rather than using hot tap water directly for consumption.
- Clean faucet aerators periodically; sediment and metals can collect there.
- Stay alert for any boil water advisories issued in your area (these are usually for microbial contamination). If one is announced, follow it strictly and only use boiled or bottled water for drinking, cooking, and brushing teeth until authorities give the all-clear.
5. Get Involved and Advocate: If your local reports show problems (or if your area has old infrastructure), community advocacy can make a big difference. You can:
- Attend public meetings of your water utility or city council to ask questions about water quality.
- Support bond measures or funding initiatives that aim to upgrade water treatment plants or replace lead pipes. Aging infrastructure is a major cause of contamination, and investing in improvements is key to long-term safety.
- Join or form local water watchdog groups. Communities in places like Flint formed coalitions to demand answers and action. Your involvement can ensure issues aren’t swept under the rug.
- If you suspect data is being withheld or your concerns aren’t addressed, don’t hesitate to reach out to state environmental agencies, the EPA, or environmental non-profits. Reporting problems can prompt further testing and enforcement.
6. Alternate Water Sources: In cases of known contamination that can’t be immediately fixed — for example, a town with nitrate levels above the limit or a home with lead pipes that haven’t been replaced yet — consider using bottled water or water from a safe source for drinking and cooking in the interim. Many cities with ongoing contamination issues set up free water distribution or subsidies for filters until the problem is resolved.
By testing your water and taking these steps, you act as the final line of defense for your household’s water safety. While it’s the water supplier’s job to provide safe water, proactive measures on your part add an extra layer of protection, especially if you have vulnerable family members (infants, pregnant women, immunocompromised individuals) who are more susceptible to contaminants.
Conclusion
Water is life — and keeping it clean requires both trustworthy information and proactive effort. We’ve seen that staying informed through local water quality reports and contamination maps is essential for every citizen. When you know what is (or isn’t) in your water, you can make better decisions for your health, whether that’s lobbying for pipe replacements, installing a home filter, or simply resting easy knowing your water is well within safe limits. Publicly available data, from annual CCR reports to interactive “water contamination map USA” tools, empowers us to ask the right questions: How safe is my water supply? What contaminants should I watch for in my area? By regularly reviewing your water quality report and utilizing the resources discussed, you can confidently answer the common query, “Is my water safe in [State/City]?” with facts.
In an age when environmental data may sometimes be obscured or delayed, it’s reassuring that concerned communities, scientists, and organizations are working to bring transparency — whether by mapping PFAS plumes or pushing for stricter standards on contaminants like lead and nitrates. Remember that achieving safe drinking water is a shared responsibility: governments must enforce strong standards, utilities must properly treat and report water quality, and we as individuals must stay engaged and take precautions when needed.
…safe drinking water is a shared responsibility.
Ultimately, the goal is that every American can turn on their tap and confidently drink a glass of water without worry. Reaching that goal means paying attention to the numbers in those reports, speaking up when something’s amiss, and investing in solutions that ensure clean water for all. Water contamination data is critical for public health, and by staying informed and proactive, you become a crucial part of the solution — safeguarding your family’s health and contributing to the broader push for water safety in your community and beyond.
References
- builderonline.com
- epa.gov
- britannica.com
- dph.illinois.gov
- 19january2017snapshot.epa.gov
- desmoinesregister.combuilderonline.com
- who.int
- sdwis.epa.gov
- cdc.gov
- ewg.org
- usgs.gov
- raqc.org
- epa.gov
- 19january2017snapshot.epa.gov
- epa.gov
- epa.gov
- epa.gov
- desmoinesregister.com
- usgs.gov
- njspotlightnews.org
- usgs.gov
- britannica.com
- desmoinesregister.com
- ewg.orgiowapublicradio.org
- who.int
- epa.gov
- epa.gov
- epa.gov
- epa.gov
- epa.gov
Production note: manually curated and edited with research assistance by ChatGPT.